

FullStory Shows the Real Experience Behind the Numbers
Question for you...
FullStory asks you point-blank: “Do you know the truth about your customer's digital experience?”
Well, do you?
Can you count solely on customer feedback, which, when forthcoming, can sadly all too often be negative?
What if there were a way to get a closer look inside the customer’s experience, whether positive or negative? That insight may be valuable not just for an individual customer, but for optimizing the overall experience of your digital enterprise.
This is the FullStory solution. It’s what they call a “digital intelligence platform.”
It’s sort of like a video recording of the customer’s actions on a website... but not quite. It’s more sophisticated than that.

Recreations rich with context
Imagine some grainy black-and-white security camera footage of a store. Watching it, you see a lady come in, browse some items, exchange pleasantries with a sales rep, and then leave.
Sure, you get a faithful visual playback of the physical movements within that space. But can you really get a sense of why that lady came in, or more importantly, why she left without buying anything?
That video is raw footage; it’s uninterpreted data. And even if there were one hundred cameras and microphones scattered about the store, all you’d get is more of the same.
What you need is to understand the lady’s experience. For that, you need context.
Now, imagine that instead of raw video, you were able to recreate the lady’s experience through a number of contextual means.
For example:
The sales rep can walk you through what he saw and heard
You’d know all the specs of every item she looked at
Maybe a psychologist would analyze her expressions and gestures for signs of frustration
Perhaps a private eye could tell you what other places she visited before coming to this store
What if some sort of divine comparative statistician could aggregate her current experience with her past ones, or compare her experience to every other shopper in that same store, all within a designated time frame…
With all this living breathing contextual data you would be better equipped to recreate this lady’s experience in such a way that offers far more insight compared to that grainy, passive recording.
And presto: FullStory!

Get out of the woods
FullStory understands that all the data in the world still won’t be able to tell you why a customer bounced.
In their words: “Analytics are always an abstract representation of what's actually happening... Traditional web analytics miss the forest for the trees.”
To break down FullStory: The app records contextualized sessions of website visits. These sessions can be played back, shared and analyzed. Then there are sophisticated search features which create saved segments for further analysis and comparison, and all using clear visuals.
The FullStory major plot points
Sessions, segments and “searchies”
For starters, installation is a matter of inserting one line of code into your backend, no matter how complex the site is.
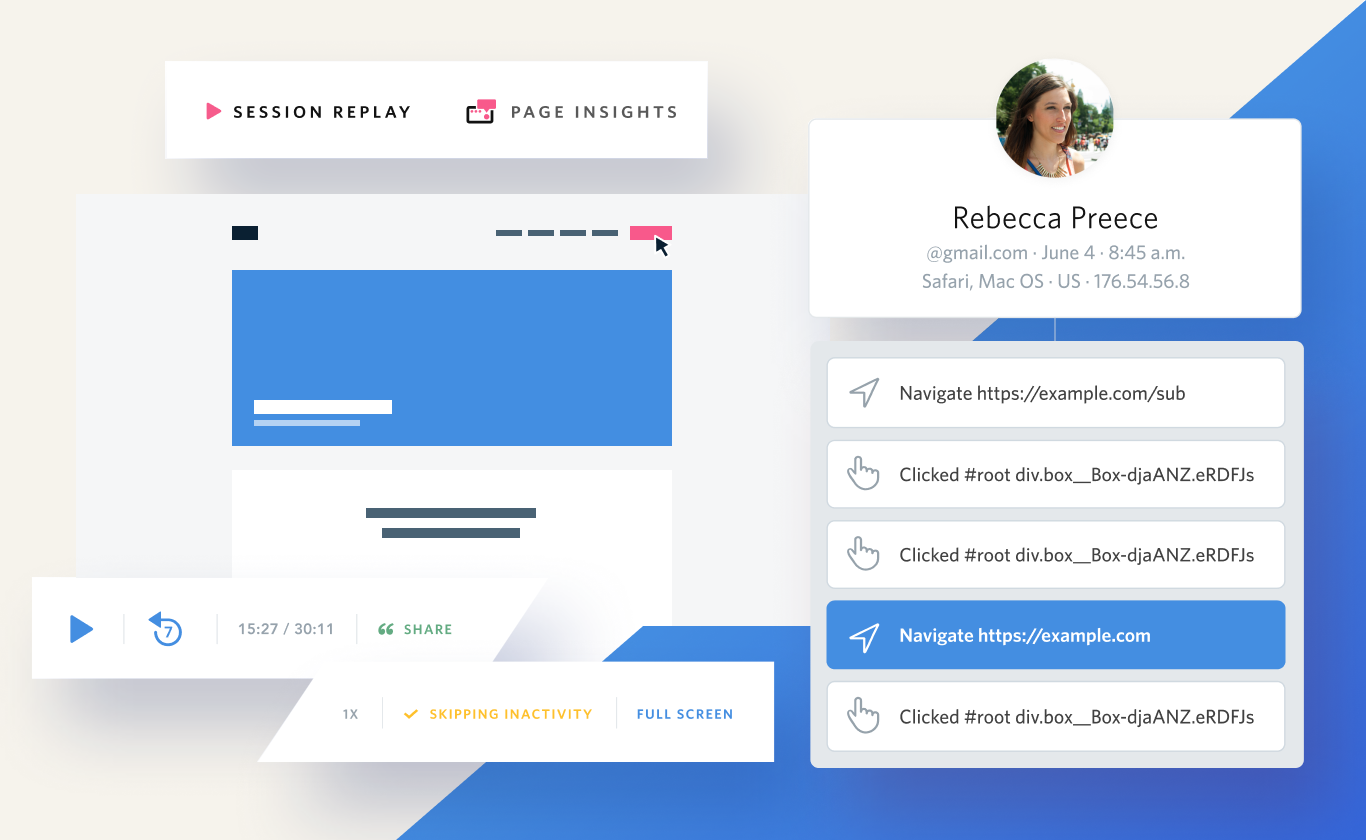
Right away when your pre-existing customers return to your site, their info, like email and history, is available as you record their experience. These recordings are called “sessions.” Likewise, any information given by new visitors gets attached to their session.
These sessions basically look like a video recording of the user’s screen, watching their mouse move, the text being typed, and page navigations. Except its not video; it’s that superior form of experience recreation, which happens at a deeper level of coding.
While the point is not necessarily to have someone watching every session live (though that is possible), the sessions can be pulled up by support staff while chatting or on the phone with a customer. From there it’s easy to scroll through the session to pinpoint whatever issue they’re dealing with.
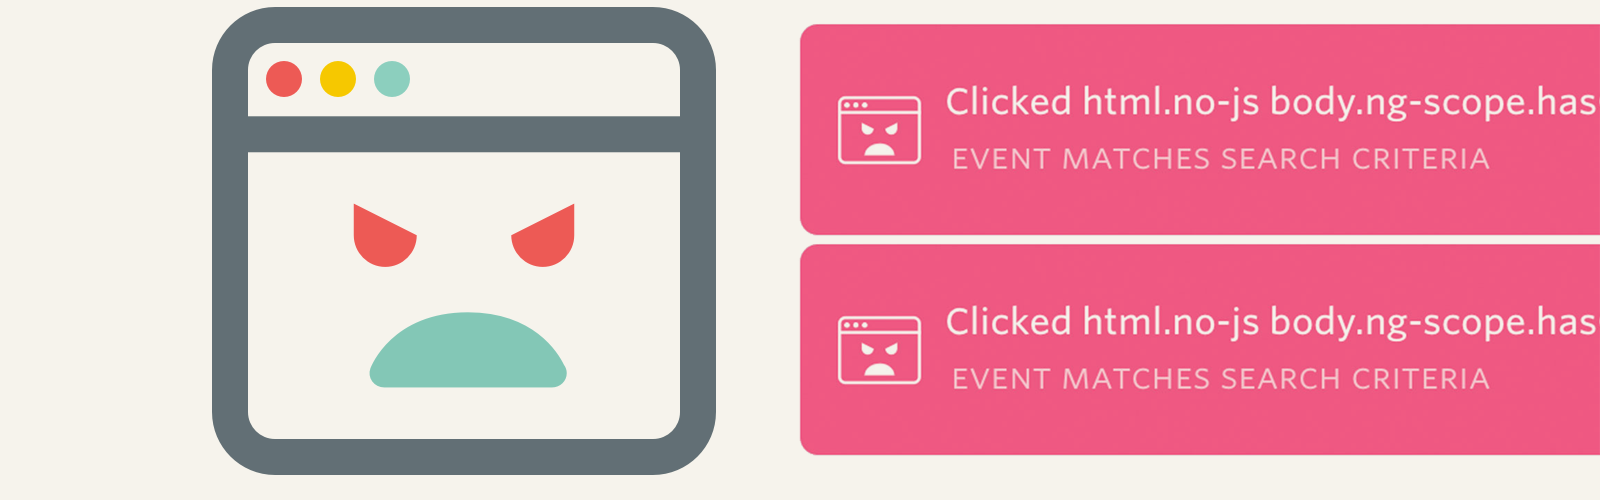
This means no more tension rising as customers and support struggle to understand exactly what went on. One thing the software is especially cued for is to pick up on “frustration” events: error clicks, dead clicks, rage clicks and thrashing mouse (that last one sounds like it could be a death metal band born out of Silicon Valley).
Outside of dealing with specific customers, all those segments are just dying to be searched through on more aggregate levels to reveal what wisdom lies within.
Every search that’s performed creates what they call a segment. These segments are metric building blocks to both a broad overview, as well as to highly-specific details of a site’s activity.
Searching for segments automatically brings up a visual display of the results, which they call “searchies.” There are tons of visual variations and metrics on offer. Best of all, by clicking on any element in a visual, like a bar in a chart, you zoom in on the customers that comprised that block of data, and from there you can view their specific sessions.
It’s like a short circuit between big-picture data and the real-life user experience at its heart.
You always return to a segment and compare how its numbers have changed over time. For example, if you did a search of everyone who answered a CTA, then one month later pull up that saved segment, it will compare the current results with the ones revealed the first time around.
You can also set limits which will trigger notifications. For example, if an average search result shows about 100 visitors on a page per day, you can set a notification if that number drops below 50 or exceeds 200.
Modular funnels and hot hues
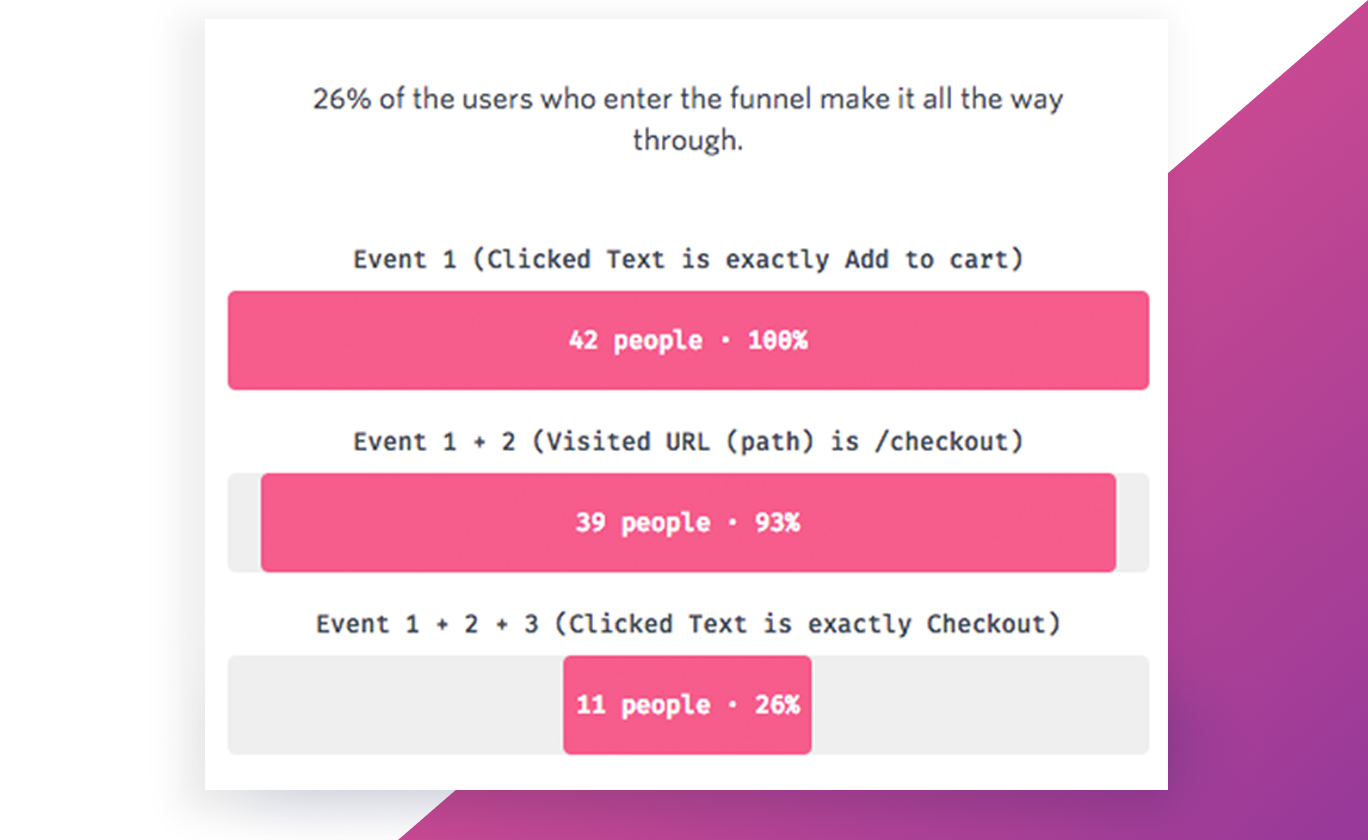
One awesome feature is the ability to set up your own funnels. Here’s how it works. You pull up a full funnel and see each step of the customer journey, with diminishing percentages at each narrowing stage. For example:
80% of visitors opened a promotional email
60% clicked the link in the email to land on the promotion page
40% of those people viewed one promotional item
20% added the item to their cart
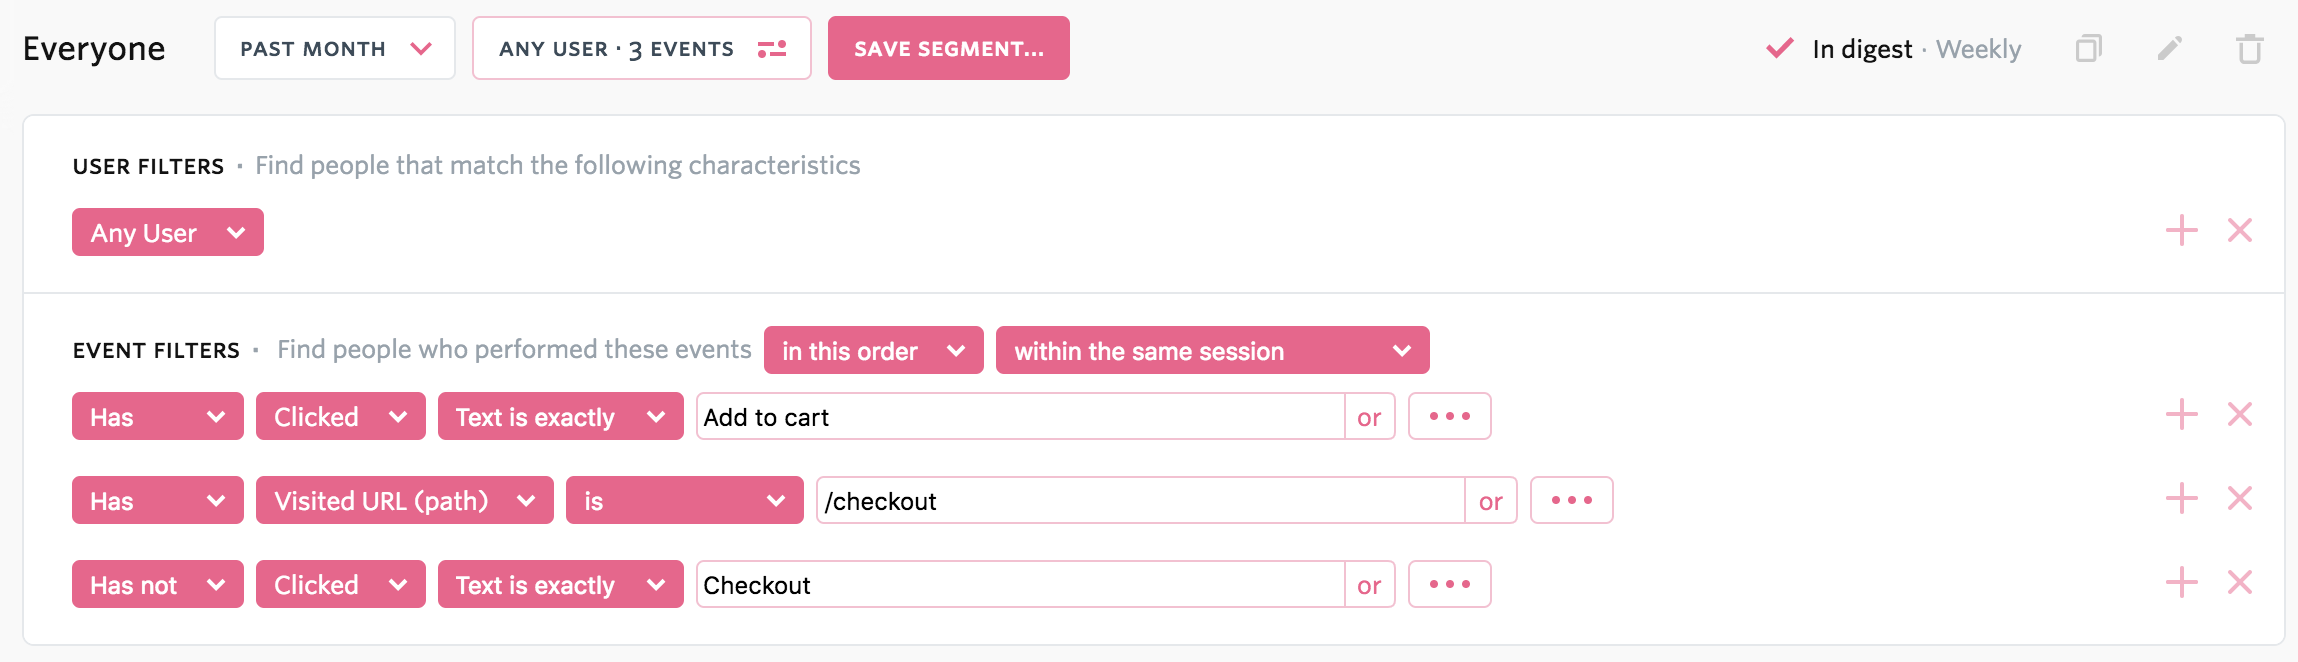
You can then select any two of the above events to get an instantly adjusted percentage in the form of:
‘Has Not’ or ‘Has’
As in: Show me the amount (of visitors) that “has not added an item to cart” divided by the number that “has clicked the link.”
The different percentages from these variable equations can offer surprisingly deeper insights than standard step-by-step funnel stats.
Aside from watching and searching through sessions, there’s a heatmap for a more static view of a page acted upon by any number of visitors.
Here, it’s not just the ‘most clicked’ areas that are revealed by degrees of bright hues, but one can also fine-tune the heatmaps to pinpoint details like the ‘most error clicked’ and others.

Collabs and more
Collaboration is clearly key for any company making the most out of a digital intelligence platform. Segments can be shared among team members, and each can add notes at various points in the timeline. One can also share directly to Slack or even create special access for a “guest” outside the company.

Aside from Slack, FullStory has a flexible API for both turnkey and manual integrations, with everything from Salesforce Cloud and Zendesk, to Shopify and Wordpress + WooCommerce.
The next chapter in digital intelligence
The founders of FullStory were all ex-Googlers who broke off on their own. It wasn’t a hostile parting, though, as Google Ventures was a big part of their first round of funding.
That’s a blessing and a vote of confidence by an internet titan, to say the least.
FullStory’s product truly packs a punch and despite the myriad ways it can help website engagement by offering faithful recreations of a visitor’s experience, onboarding the team to its full functionality is quite fast and easy. The dashboards speak for themselves, and the visuals are gorgeously clear.