Buffer Releases Analyze — Social Gets Answers
To the uninitiated, the optics of analytics might bring to mind sci-fi scenes of wall-to-wall touch-screen rooms with matrix-like strings of code streaming around a roboticized multitasking brainiac.
Seems cool, but you think you could actually get any work done like that?
Well, over at social media management company Buffer, they have something else in mind: Analyze. It doesn’t aim to be cyberpunk, it aims to quickly, easily deliver key social metrics in the least distracting way possible.
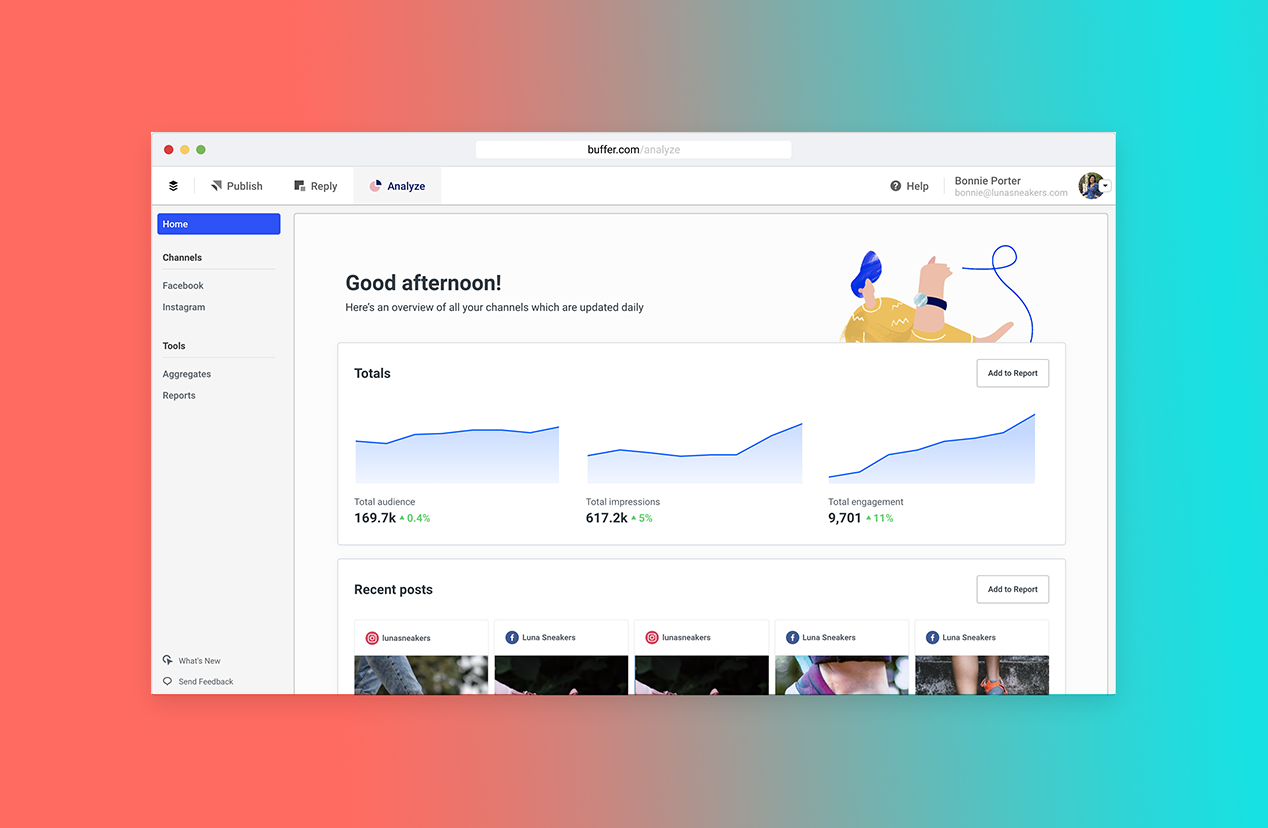
Analyze is a separate analytics tool from the platform’s core scheduling product and works for Facebook pages, Twitter, and Instagram Business accounts. It has an uncrowded dashboard, “two-click” reporting, and just the right amount of metrics and displays to choose from without feeling overwhelmed by avalanches of overly-technical options. Because option overload—with its steep learning curve—only ends up hindering productivity. Analyze is about boosting it.
Analyze Answers

Analyze takes a more everyday human approach to analytics, as opposed to a platform that looks like it was designed by—and for—whizzes, wonks and quants. Basically, it’s the kind of analytics platforms that answers the most obvious questions a social media manager will have:
What are the best kinds of posts?
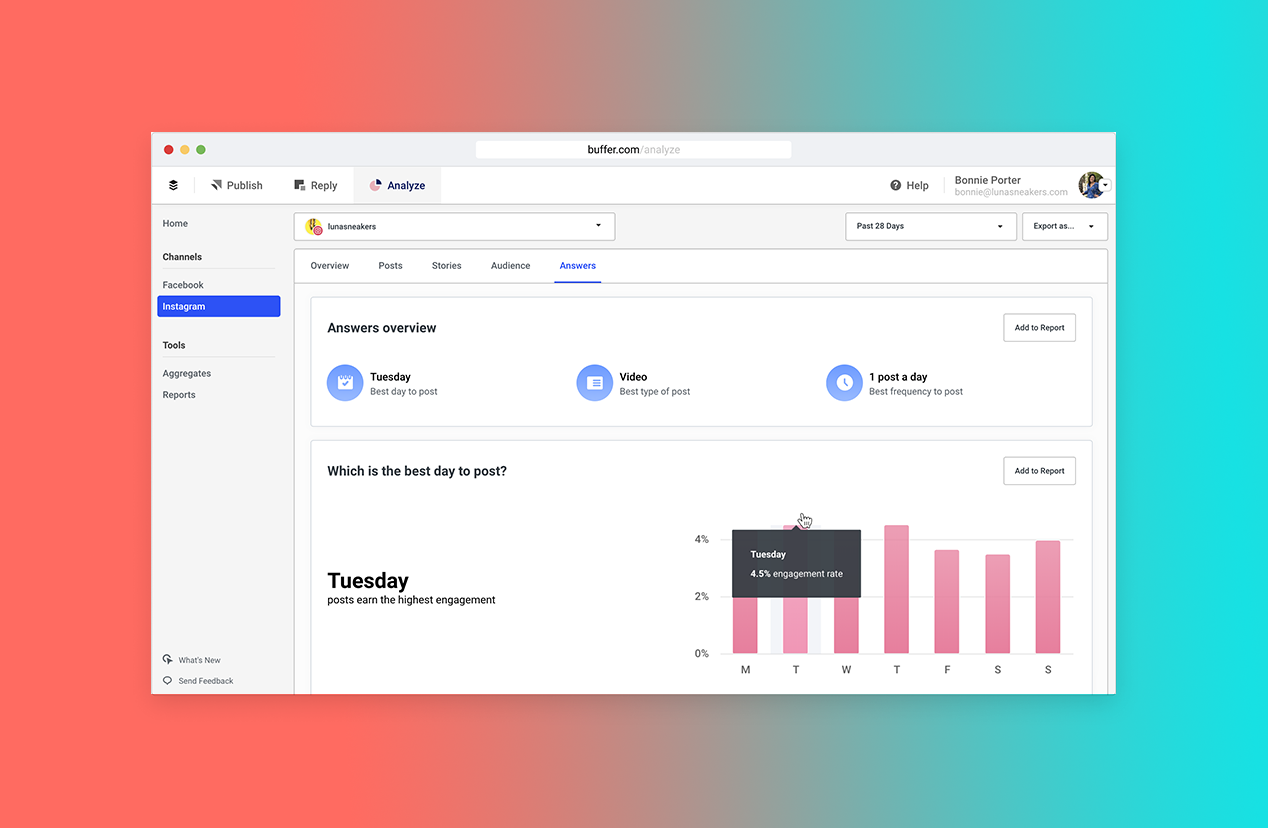
When is the best time to post?
How often should I post?
In fact, “Answers” is one of the main tabs up top, giving you straight-up answers to these questions for Facebook, Twitter, and Instagram. Literally, open it up and you might see something as direct as:
“Pictures. Monday. 3/day.”
Of course, these are not permanent answers but are updated and tailored specifically for you by Analyze based on your social engagement history.

Measurement
With the “Measurement” tool, you can aggregate your performance data across Facebook pages, Twitter and Instagram Business accounts into a general overview, view the stats for one account at a time, or drill down into specific posts.
While the dash sticks to headline-grabbing figures, hovering the mouse cursor over, say, a bar on a graph, more specific details are shown.
Channels and profiles
Say you’re measuring the performance of an Instagram account for the last 30 days. You’ll see the number of posts, impressions, reaches, likes, comments, and new follower count; as well as a percentage marking the increase or decrease of these figures in comparison to an earlier period.
Posts
You can see all your posts in a detailed list mode, clearly showing the image and the accompanying text, along with the usual stats and engagement rates.
The list can be sorted by a number of metrics (for example, dates, number of likes), and you can search by keywords or hashtags.

IG stories
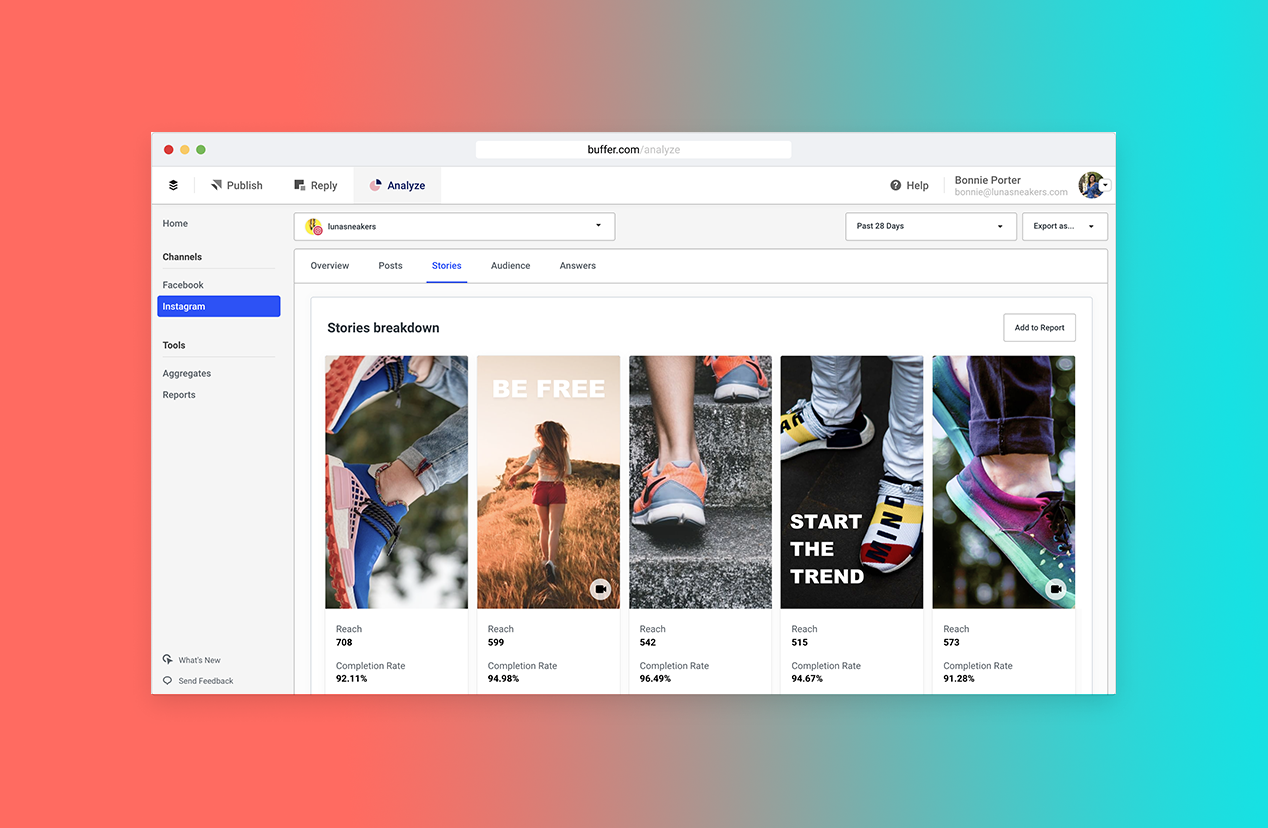
Instagram stories are shown separately from posts. The breakdown is shown in a grid view, displaying the reach for each story.
The platform also shows the completion rate; since stories take time to watch, you know what percentage of people who started made it to the end.
Audience demographics
Finally, Analyze gives you a sense of who you’re reaching, with an audience demographic dashboard. These details are broken down into gender, age and location.
Reporting and updates

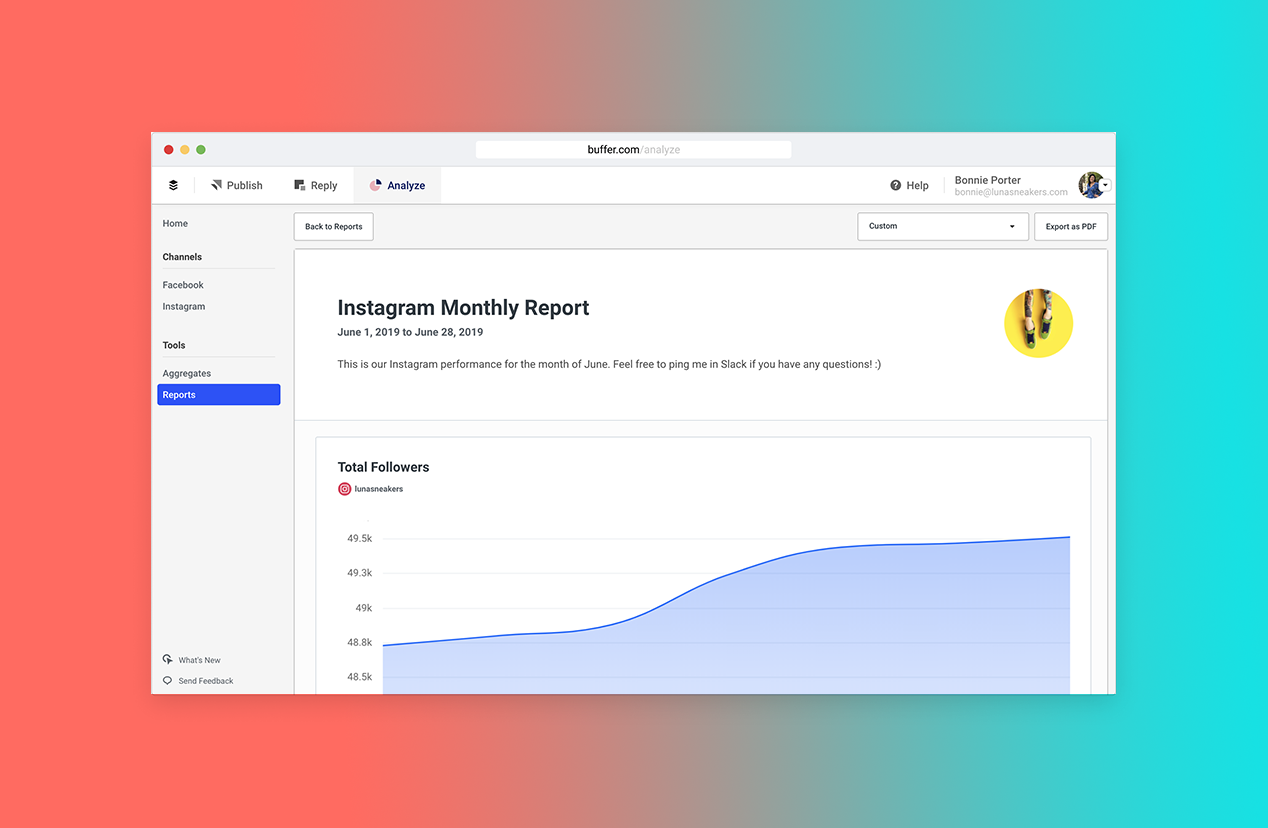
When viewing your analytics for channels, profiles or posts, you’ll always see the “add to report” button. Two clicks and you get a nice document ready for export as a PDF or image. You can even add your company logo, slap on any title you want, and add a cover page.
There’s also a feature that allows you to set up reports based on your custom metrics. These will then auto-update themselves, which is great for quick daily updates.
Just the sandwich or the trio?
Analyze isn’t only available for Buffer users. It’s a totally standalone product.
Whereas some other platforms are engaged in this endless quest to add every tool ever conceived of as part of their stack, Buffer aims to stay light, affordable and flexible.
The point is: Customers get what they need, and nothing more.
Of course, for Buffer users, Analyze will round off a nice trio of tools with Publish, which helps teams prepare and schedule posts; and Reply, which is a shared social inbox and engagement tool.
Analyze on its own comes to $50 per month, and that’s good for 10 social media accounts. For full bundle plans, you’d have to speak with a Buffer rep for a quote.
Worth the wait
Analyze has been two years in the making, hitting the ground in the summer of 2017. They launched Analyze with their first paying customer in February 2018.
It should be noted that Buffer was not without any analytics prior to Analyze. They had as part of Buffer Publish a range of analytics tools. However, looking at the newer Analyze dashboard, it’s clear this fresh take is much easier to digest.
Let’s grow together
Among the big names already using Buffer Analyze are Spotify, Shopify, and Huckberry. But aside from these well-developed names, Analyze is even more ideal for brands that are still growing.
With the right combination of clean data, solid recommendations, and snap reporting—and little else to get in the way—Analyze doesn’t even feel like an added work tool. It’s just simply there, unobtrusive as a clock, serving its purpose, making work easier. Because for companies without large dedicated social analytics departments, simplicity matters.


