Snapboard: A Metrics Dashboard for Hackers
Here are some things most people can accomplish over the span of a week: cleaning their apartment, finally responding to all of those outstanding emails, going away on a cottage vacation. Here’s something that most people CANNOT accomplish in a week: planning, developing, and releasing a fully functioning user-facing software.
Snapboard is the first application stemming from self-described tech entrepreneur/indie hacker Calum Moore’s development challenge, which he aptly calls 1ProductaWeek.
Moore created the business metrics platform as a response to a problem he felt consistently cropped up throughout his career: rigid analytics dashboards lacking in customizable features.
The Snapboard solution offers a fully editable dashboard that pulls data and metrics from all of your pertinent apps, displaying them as customizable cards, all on one dashboard.

The project marks Moore’s attempt to cut out the endless red tape that can come along with developing user-facing software. In the post-mortem for the launch of Snapboard, Moore states:
“I plan to create products around problems that I experience myself. That means there’s at least one person in this world who cares passionately about the problem, knows the problem inside out and has searched for an alternative and come up empty-handed.”
The (Snap)board game

Snapboard is totally free at its basic tier, which allows you to modify your dashboard with pre-built analytics and integrations cards, and to share view-only reports with your colleagues.
If you want more customization, you can pay $10 per month to unlock faster data refresh rates for your metrics, the ability to add co-editors to your dashboard, as well as access to the custom-card builder.
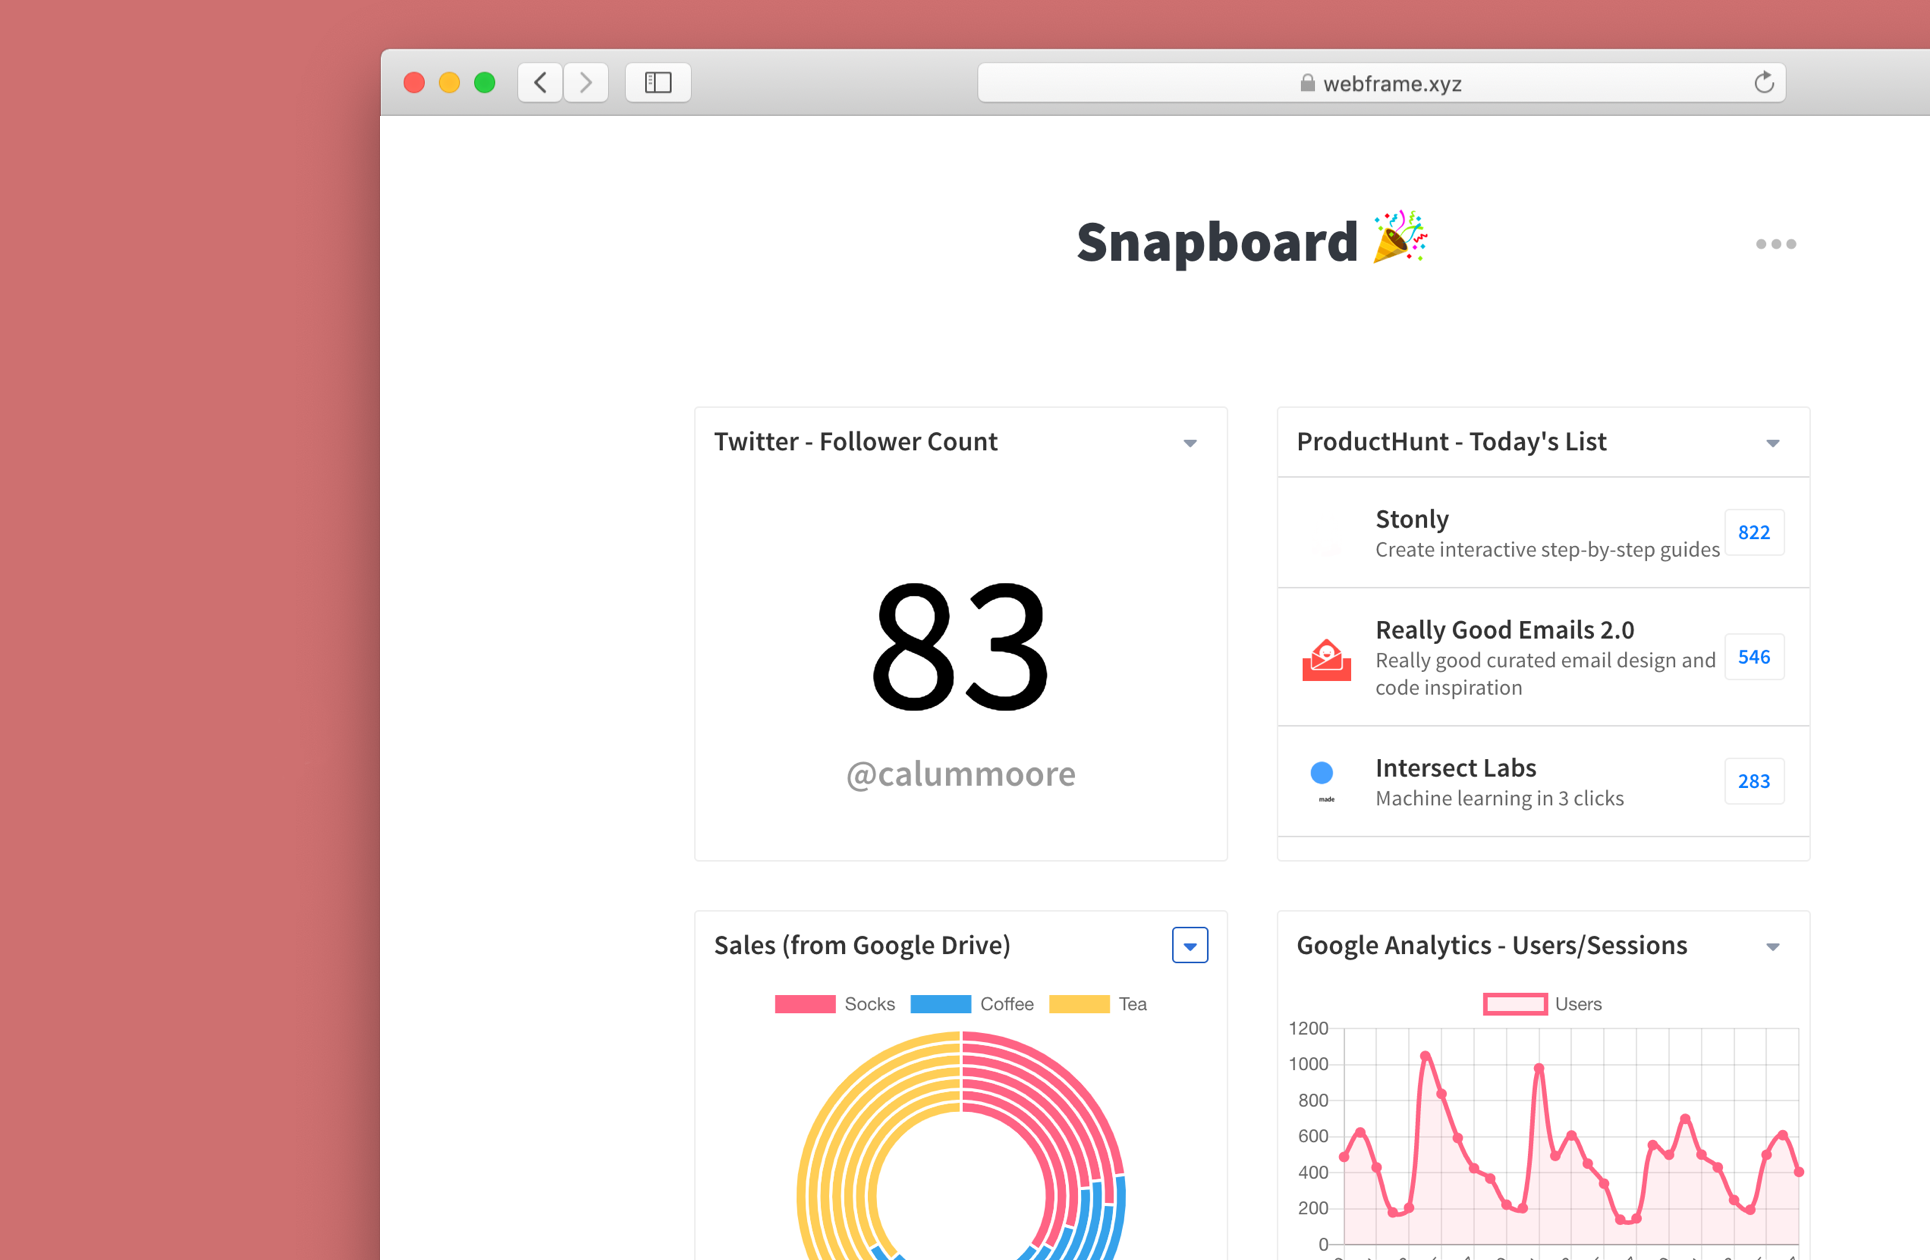
After you register, you are brought to Snapboard’s landing dashboard. The first thing you may notice is the software’s simplistic, elegant design, but more importantly, the fact that you can jump right in and start building your dashboard with analytics ‘cards.’
So how, exactly, does the software work?
Analytics cards
Cards are the bread and butter of Snapboard. These are essentially bite-sized displays of all your charts and data.
Each card is customizable and represents an isolated unit of code. Think of Snapboard’s card system like lego blocks—you combine them together to build a dashboard that works for you. Card templates can be saved, and then re-used and implemented into different boards and workspaces.
It is important to note that while Snapboard is customizable, each open source card requires a certain basic knowledge of HTML, CSS, and Javascript.
If the idea of hacking is, in your best opinion, left to goggle-wearing street punks in some distant dystopian future, then you can pay the developers at Snapboard 50 bucks to have them custom-build cards to suit your needs.
Board
The board is where you place all of your preset or custom-built tracking cards. This is where you’re going to organize all of your shiny numbers and charts so that you can view all your business metrics in one place.
If you’re using the free version of the software, boards can be shared with peers as read-only reports. Otherwise, they can be freely shared with and customized by other paid users.
Editor
Snapboard’s editor is simple and divided into four separate tabs: General, Component, Input, and Data.
General is where you give birth to a card, assigning a name and description. The Component section is where you create the look of your card with React. Input is where you assign options for your user to configure and the Data tab of the editor allows you to run server-side Javascript, passing any value you desire back to the component.
Integrations
For those who are coding adverse, there is a selection of pre-built template cards that integrate seamlessly with 20+ apps that you may want to track; ranging from the Google Suite to Instagram to Shopify and several more in the works, such as Asana and Paypal.
If a particular integration that you need is missing from the templates, you can use the React components to ‘hack’ your own. You also have the option to make your card ‘public’ and share it with the rest of Snapboard’s community. The DIY, community-building aspect of Snapboard is one of the truly awesome things that sets it apart from competitors.
Of course, if you have the developing chops to do so, the integrations list becomes mostly irrelevant. With the right know-how, the number of possible integrations can become endless.
Like a snap of the fingers

The main motivator of Moore’s 1ProductaWeek process is certainly admirable: cancel out all of the fluff and indecision that comes with app development, and cut straight to the core question—can this software solve a problem and will users be interested in using it?
Snapboard launched at the end of July 2019, so its ultimate success and lasting power is TBD. According to Moore, however, the early returns are encouraging. The launch week stats are as follows:
7.5k unique visits
1.2k account signups
49 custom cards created
With a clear purpose, an extremely competitive pricing model, and an elegant, customizable design, all signs seem to point to Snapboard becoming a new standard for metrics dashboards.